California Association of Realtors monthly data for the San Francisco Bay Area
Author bio section

I am the author of this blog and also a top-producing Loan Officer and CEO of InstaMortgage Inc, the fastest-growing mortgage company in America. All the advice is based on my experience of helping thousands of homebuyers and homeowners. We are a mortgage company and will help you with all your mortgage needs. Unlike lead generation websites, we do not sell your information to multiple lenders or third-party companies.
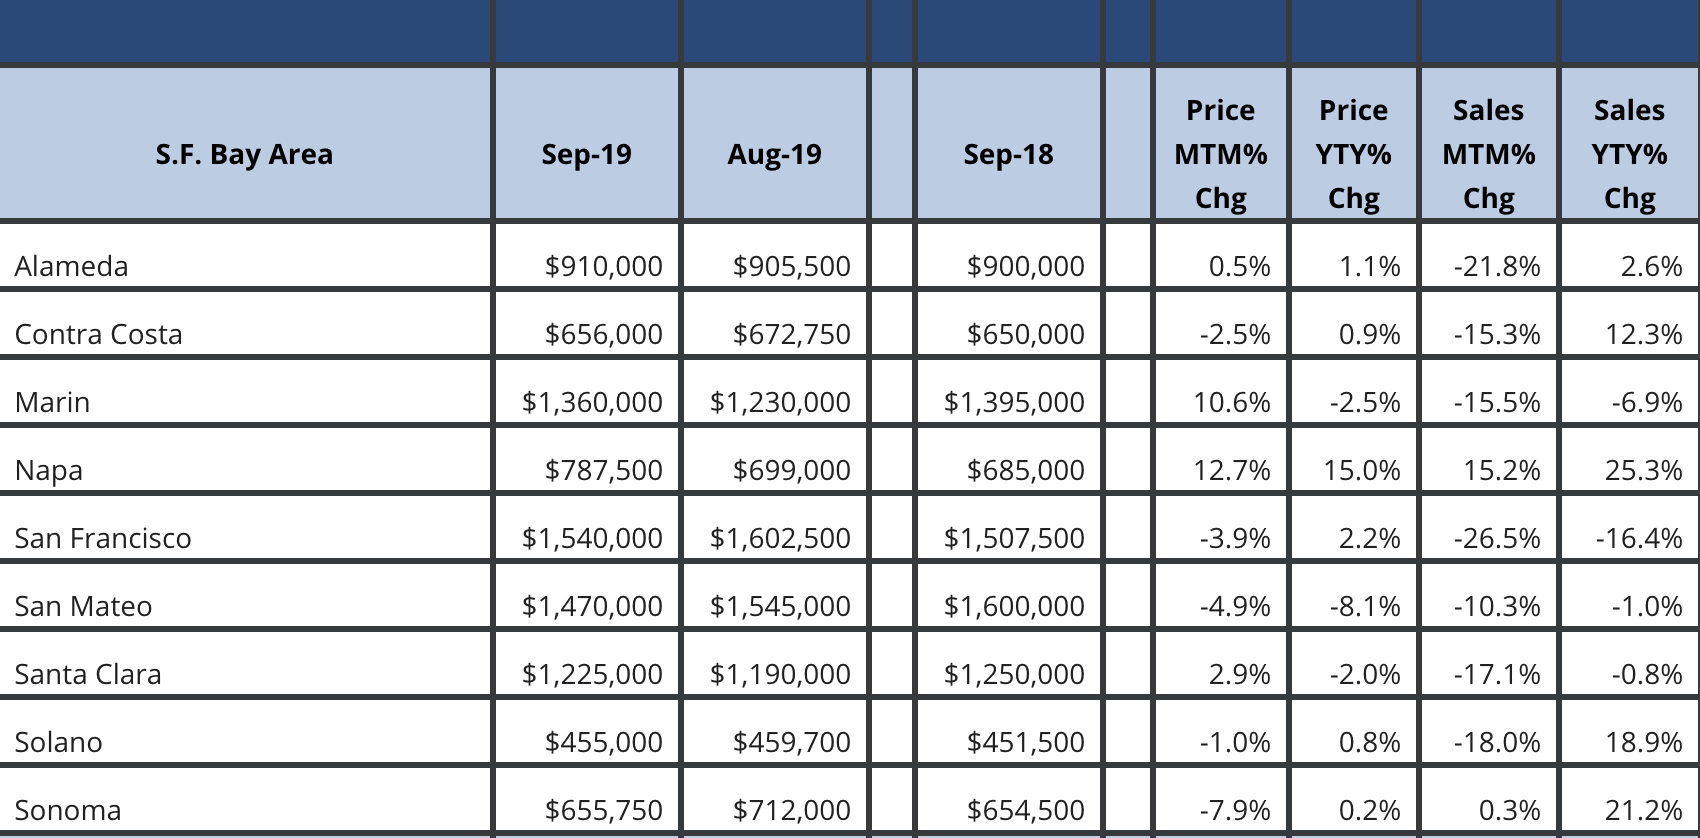
The California Association of Realtors’s (CAR) housing market statistics reveal that the San Francisco Bay Area has had a mixed September when it comes to median sold prices of existing single-family homes. While Alameda, Marin, Napa, and Santa Clara are closing in the green, Counties Contra Costa, San Francisco, San Mateo, Solano, and Sonoma have not been equally lucky. In terms of the percentage decline of median prices, Sonoma has suffered the most. On the other side of the spectrum, Napa has done exceedingly well, followed on its heels by Marin.
Counties showing gains in September
Alameda’s median sold price for existing single-family homes has stood at $910,000 in September. This is an uptick of 0.5% from August’s $905,000. Year-over-year, Alameda’s prospects have improved by 1.1%.
Marin has posted a formidable $1,360,000 in September. This is a 10.6% upswing compared to August’s $1,230,000. Interestingly, the year-over-year median sold prices have dropped by 2.5% from the September ‘18’ figure of $1,395,000.
Napa has rallied most in September, according to the CAR data available to us, exhibiting a hike of 12.7%; the corresponding figures for August and September being $699,000 and $787,500 respectively. Equally, and in fact, more appreciable has been its year-over-year turnaround- a 15% rise from $685,000 recorded in September ‘18’.
Santa Clara’s 7-digit median sold price for existing single-family homes stands at $1,225,000 for September. This is a modest 2.9% rise from August and a near equal 2% decline from figures posted in September ‘18’.
Counties in the red
Talking of counties that have traded in the red, Contra Costa’s prices have fallen by 2.5%- from $672,750 in August ‘19’ to $656,000 in September ‘19’. Interestingly, it has closed positively compared to where it was in September ‘18’ (a 0.9% hike), reveals the CAR stat.
San Francisco’s $1,540,000 looks redoubtable but it is a good deal below $1,602,000 that the county had posted in August- a shade under 4% down. Like Contra Costa, it has also rallied up (2.2%) in terms of its year-over-year standing.
San Mateo is down from August’s $1,545,000 to September’s $1,470,000. This corresponds to a 4.9% drop. The slide is still lenient compared to the 8.1% decline it has registered on the year-over-year reading meter.
Solano has had a 1% reduction in its median sold price value for existing single-family homes, says the CAR data ($459,700 to $455,000). In terms of year-over-year, it stands 0.8% in the green.
Sonoma has suffered a more drastic 7.9% fall, posting $655,700 in September compared to August’s $712,000. September’s number is a shade (0.2%) above the same time-last year figure.
Bay Area housing market’s terrific momentum has been arrested a good 16 months ago but not until September 2018 did it cease to post handsome year-over-year growth recordings. Stock market volatility and selloff during last September, accompanied by a hike in the interest rates had halted the rolling juggernaut of the Bay Area a year ago. Fall ‘18’ to Spring ‘19’, the housing inventory, in contradiction to the country on the whole, had been increasing. This did not affect the increasing median home prices though- up until March ‘19’, that is.
Notable is the IPO money that is creating a ripple in the high-price range but still not moving the needle in the low or moderate-price range.
Related Posts
- 83The Federal Housing Finance Agency (FHFA) recently announced new and improved 2020 loan limits for Conforming and High balance mortgages. The maximum Conforming Loan Limit for 2020 for a majority of our country will be $510,400 (for one-Unit properties). This is an increase of 5.38% from $484,350 recorded in 2019.…
- 80
 MortgageBlog.com has been named to the Top 100 Mortgage Blogs in the World, by Feedspot. The blog ranked #23 on the list of best mortgage blogs across the globe. The list is dominated by blogs and websites in the US, UK, Canada, and Australia. The list features single-author websites like…
 - 71FAIRFIELD COUNTY • 1 Unit - $601,450 • 2 Unit - $769,950 • 3 Unit - $930,700 • 4 Unit - $1,156,650 HARTFORD COUNTY • 1 Unit - $484,350 • 2 Unit - $620,200 • 3 Unit - $749,650 • 4 Unit - $931,600 LITCHFIELD COUNTY • 1 Unit - $484,350 •…
- 71Conforming (also called Conventional) loan limits for all but one Connecticut (CT) counties went up for 2020 to $510,400. See below the list of all counties in Connecticut with 2020 loan limits for 1, 2, 3, and 4 Unit properties. FAIRFIELD COUNTY • 1 Unit – $601,450• 2 Unit –…
- 70
") 2022 Conforming Limit Connecticut is $647,200 and goes up to $695,750 for high-cost counties for one-unit properties. 2022 Conforming Limit Connecticut for 2-unit properties is $828,700 and goes up to $890,700 for high-cost counties. 2022 Conforming Loan Limits for Fairfield County 1 Unit – $695,750 2 Unit – $890,700 3…
2022 Conforming Limit Connecticut is $647,200 and goes up to $695,750 for high-cost counties for one-unit properties. 2022 Conforming Limit Connecticut for 2-unit properties is $828,700 and goes up to $890,700 for high-cost counties. 2022 Conforming Loan Limits for Fairfield County 1 Unit – $695,750 2 Unit – $890,700 3…