These Charts Will Convince You To List Your Home Today
Author bio section

I am the author of this blog and also a top-producing Loan Officer and CEO of InstaMortgage Inc, the fastest-growing mortgage company in America. All the advice is based on my experience of helping thousands of homebuyers and homeowners. We are a mortgage company and will help you with all your mortgage needs. Unlike lead generation websites, we do not sell your information to multiple lenders or third-party companies.
In school we all learned the Theory of Supply and Demand. When the demand for an item is greater than the supply of that item, the price will surely rise.
SUPPLY
The National Association of Realtors (NAR) recently reported that the inventory of homes for sale stands at a 4.4-month supply. This is considerably lower than the 6-month inventory necessary for a normal market.

DEMAND Every month NAR reports on the amount of buyers that are actually out in the market looking for homes, or foot traffic. As seen in the graph below, buyer demand in February significantly outpaced the last six months.
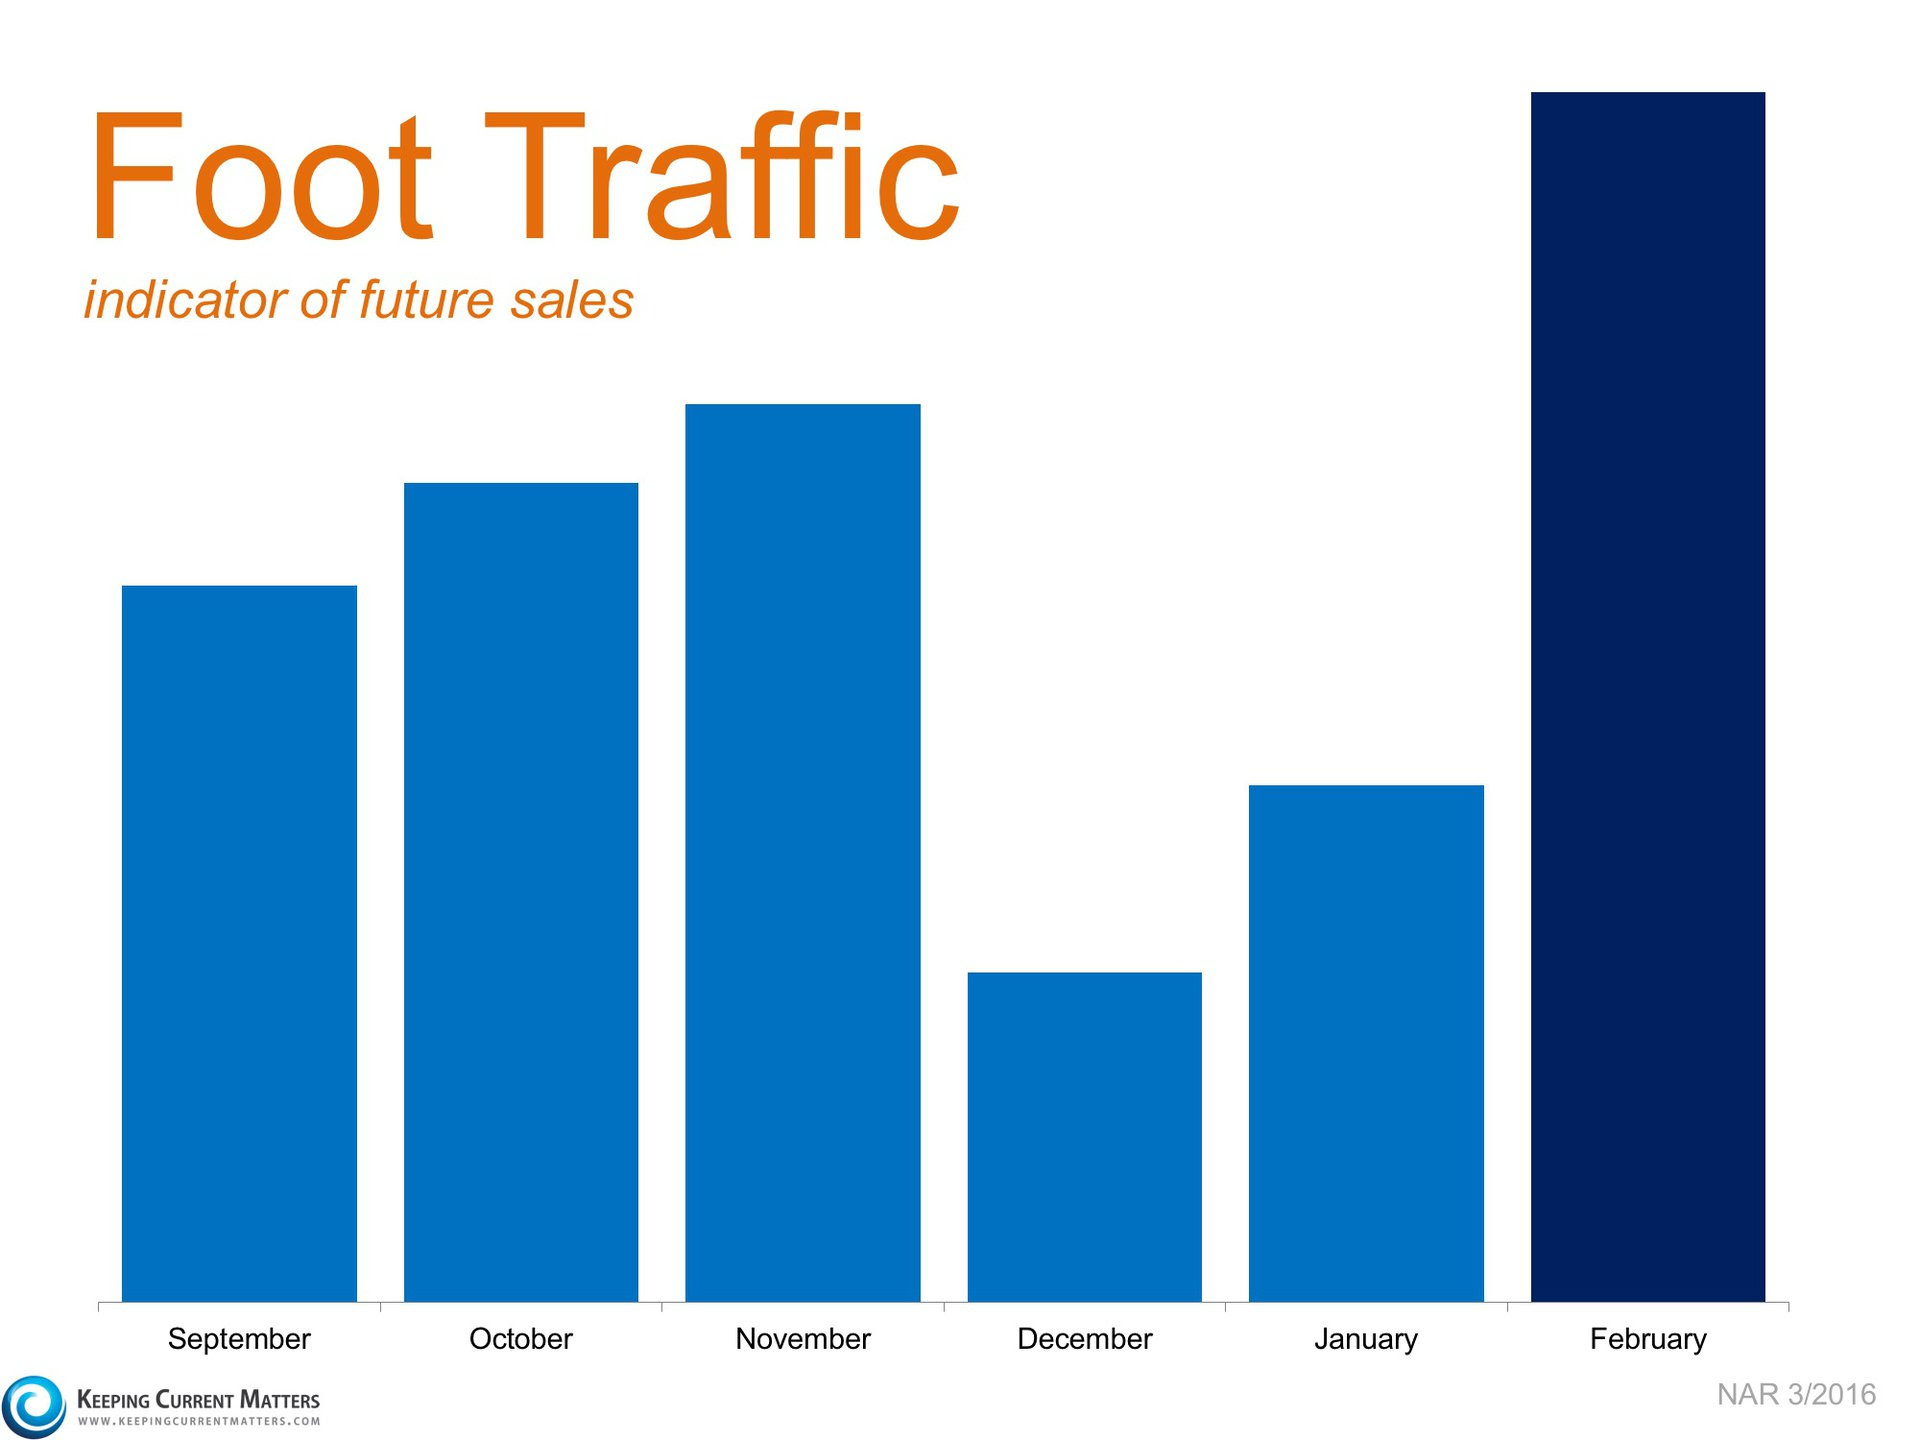
Many buyers are being confronted with a very competitive market in which they must compete with other buyers for their dream home (if they even are able to find a home they wish to purchase). Listing your house for sale now will allow you to capitalize on the shortage of homes for sale in the market, which will translate into a better pricing situation.
HOME EQUITY
Many homeowners und erestimate the amount of equity they currently have in their home. According to a recent Fannie Mae study, 37% of homeowners believe that they have more than 20% equity in their home. In reality, CoreLogic’s latest Equity Report tells us that 72.6% actually do!
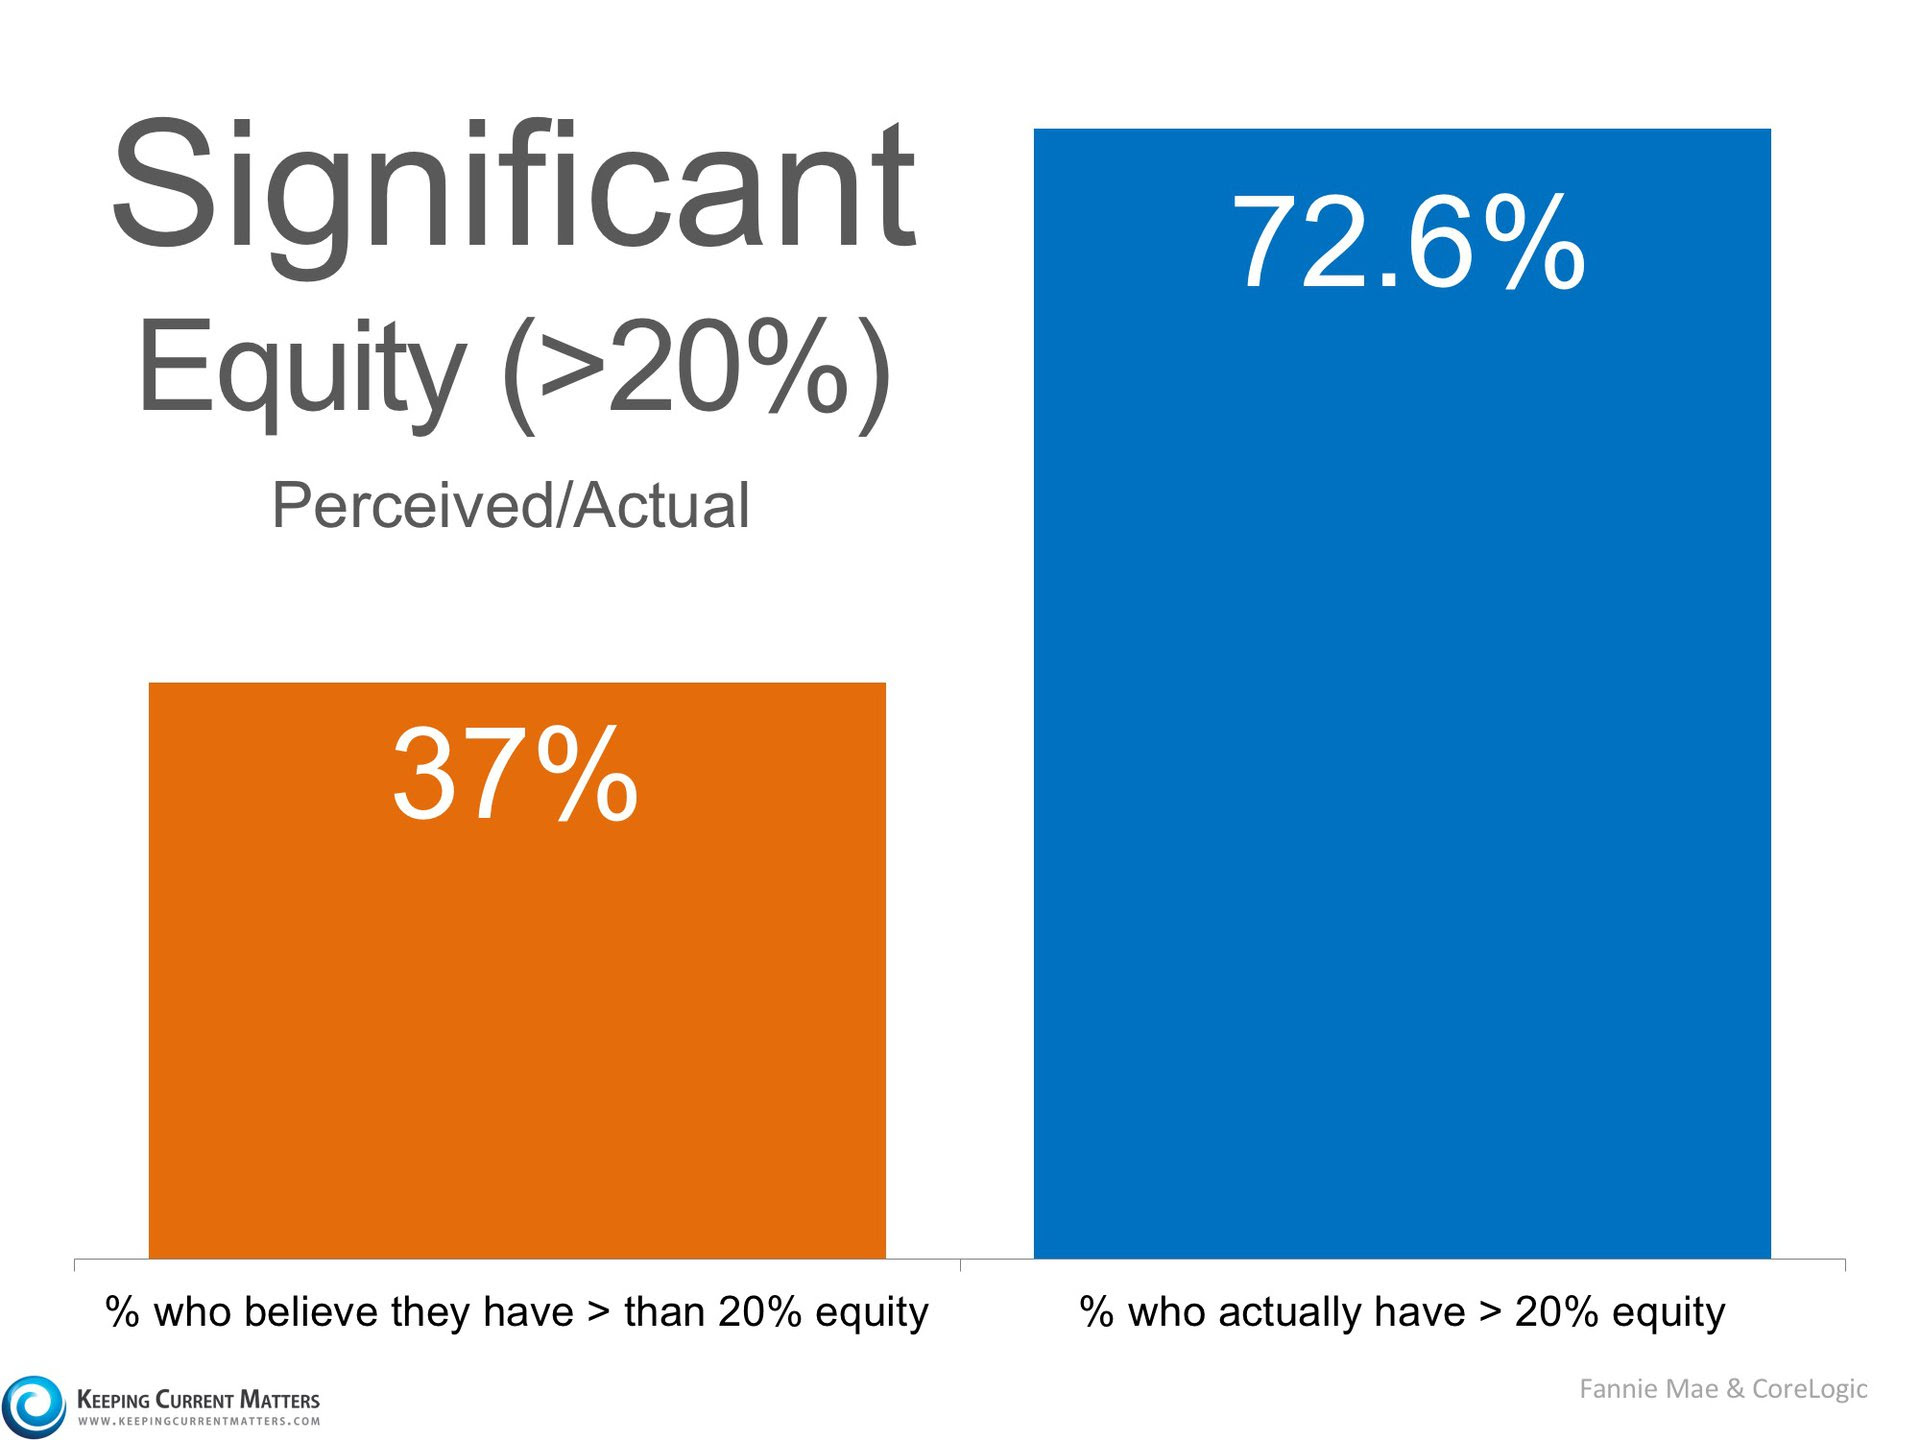
Many homeowners who are undervaluing their home equity may feel trapped in their current home, which may be contributing to the lack of inventory in the market.
Bottom Line
If you are debating selling your home this year, meet with a local real estate professional that can evaluate the equity you have in your home and the opportunities available in your market. If you need a referral for a local expert, send me an email.
Want a FREE copy of this E-Book? Send us an email at [email protected]
Related Posts
- 83San Jose Single Family Real Estate Market Report Median Price, Average Price and number of Sales - All went up in March compared to February 2011. However all three numbers were down from March 2010. Days on market (the time it takes for a home to sell after it's listed…
- 81CoreLogic predicted that California Home Prices will continue to appreciate at a rapid pace. It will remain one of the hottest markets in the country with an appreciation rate of >6% in the next 12 months. The news will be equally good across the nation where home prices are expected…
- 81San Jose Real Estate Single Family Market Report Both Median and Average Price went up for San Jose Single Family Market in October 2011 compared to September. But still remained lower compared to last year. However, number of sales was much higher than same month last year. The table below…
- 81There is an interesting insight into the homes on the market in the South Bay area. For the Santa Clara County, between the years 2014 and 2018, 90 out of 100 homes on the market in April and first half of May got sold. Compare this to 2019, when for…